Application Observability: A Developer’s Perspective
Odin (Ondřej Popelka)
TechMeetup Conference 2023
What I Do
- Senior Backend Engineer at Keboola
- Architecture, Service Design, API Design, Resources setup via Terraform, CI pipelines, Coding, Monitoring, Operations, 24/7 Support, Vacuuming, Washing the dishes, …
What We do
- Data Operating System, Data Stack, Data processing platform.
- If you have a (big)data problem, we’re likely to have it solved.
- If you have 2+ information systems in your company that do not talk to each other, we make them talk.
What does DevOps do?
- SRE gives us the Kubernetes cluster.
- SRE gives us the networking (private clusters).
- SRE gives us the monitoring tools.
- SRE watches us that we do not do anything obviously stupid.
- The UI consumes the API blueprint.
For everything else, there is Devops
Random Numbers
- 20 domain services (PHP8, NodeJs, GO + lots of Python & PHP7 + bits of Java, PHP5, R)
- 1 monolith service (~7 more domains)
- 1000+ integrations
- 120+ kubernetes nodes, 9 production stacks, 3 clouds (AWS, Azure, GCP)
- 280+ requests per second, 24+ million / day
- 260.000+ asynchronous jobs a day – ranging from 1 second to 24 hours
- 1.500.000+ LoC code, 13 developers, 4 SRE
Environment
- High heterogeneity,
- High load variability,
- High request length variability,
- Uneven distribution of requests,
Must have
- High automation, High reliability, High observability
Easy part
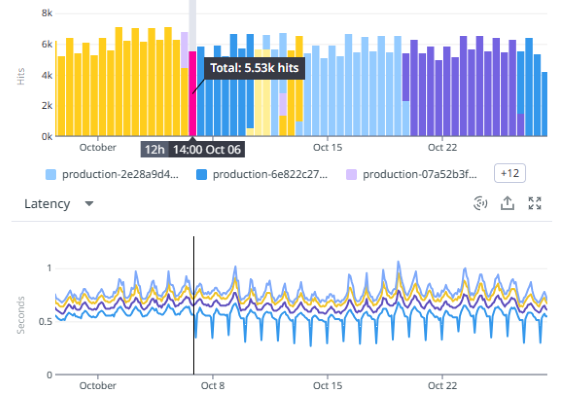
Latency is the king
- Latency is what the user feels.
- Measure XXth percentile (p90, p75, p50).
- Big difference means that the service is unstable.
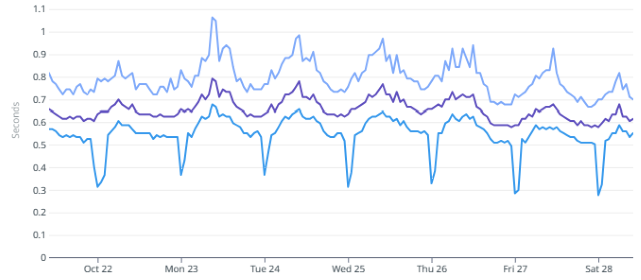
Still Easy part
- Graph of obviously bad latency
Still Easy part ?
- Graph of obviously bad latency:

- APDEX Monitoring – Application Performance Index

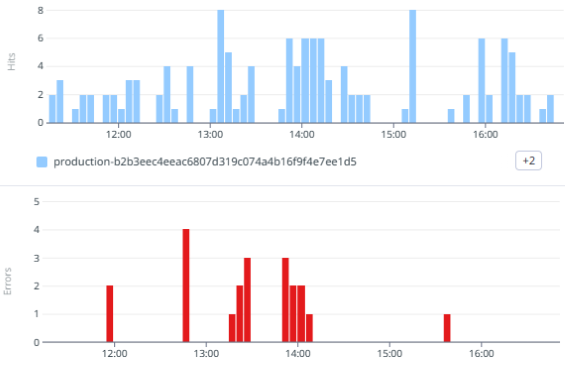
Error rate is the Queen
- The very first metric is Error rate
- First to look at when something goes wrong
- First to monitor with APDEX
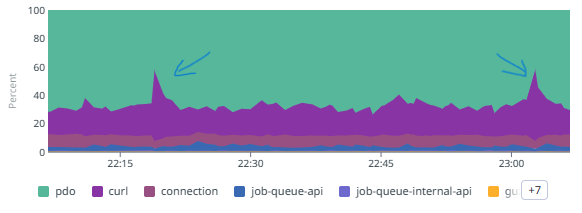
“Weird” API endpoints
- If the request fails, it’s actually a valid situation.
- Error rate can be very high, but never 100%.
- Always monitor individual endpoints not services!
- “Negative” metric – there must be at least some requests succeeding.
- I do appreciate tips on how to monitor these.
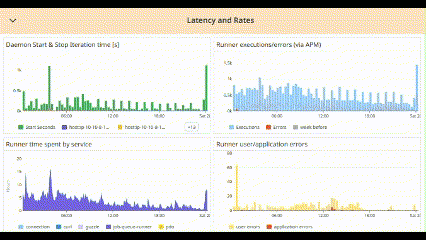
Diagnosing

- Latency breakdown;
- Breakdown of time spent in “3rd party” services:
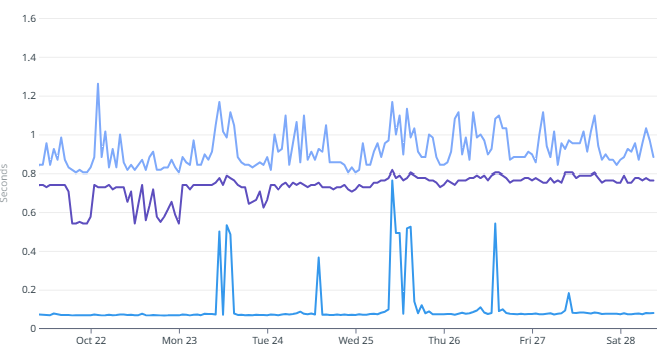
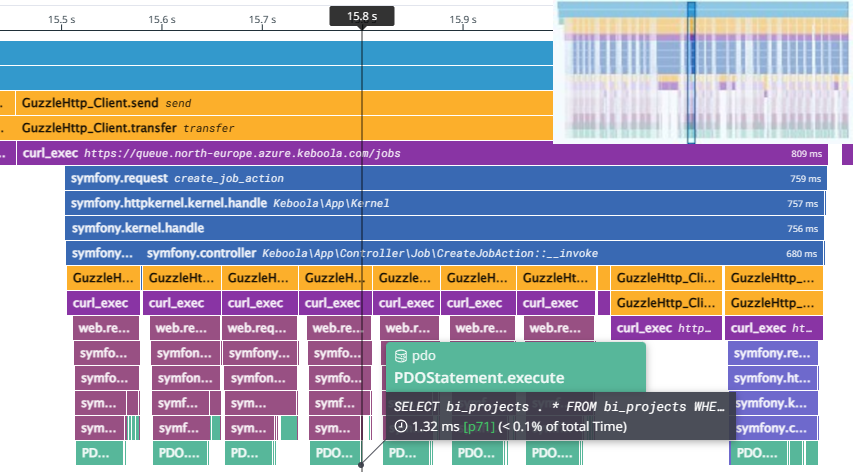
FlameGraph is God
- It is absolutely crucial that they are cross-service.
- One request:
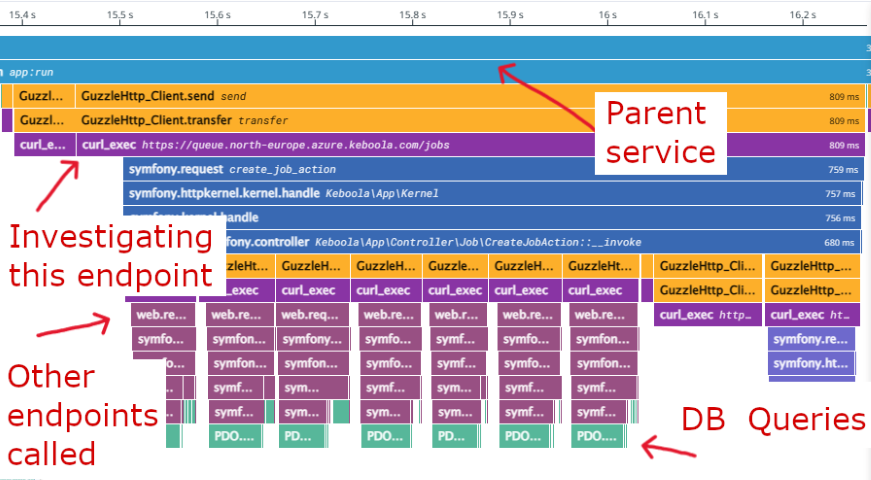
FlameGraph cont.
- Break down of time spent by the business logic:
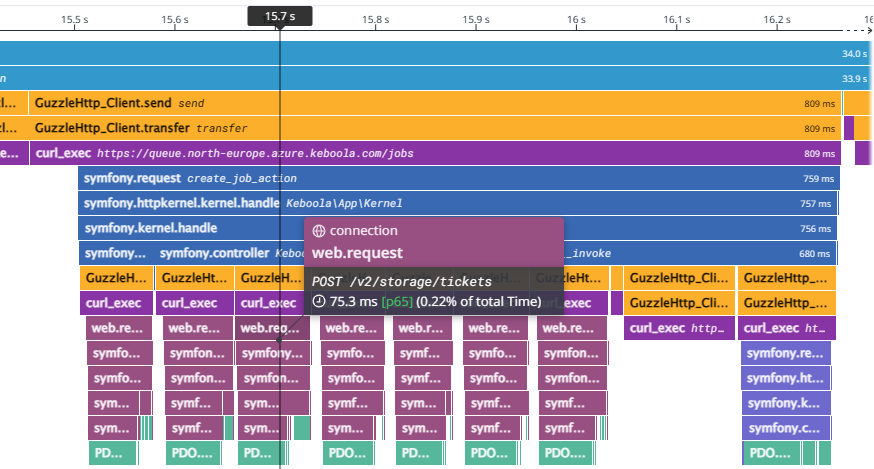
FlameGraph cont.
- Includes time in DB by 3rd party services:
What are good metrics ?

- Incident proven:
- 250+ incidents per month,
- Fail, fail, fail, succeed…
- After an incident:
- Find what metric/alarm should’ve triggered;
- Find metrics that shouldn’t have triggered;
Metrics give suspicion × Flamegraphs and traces give insight
How to get a good metric?
- Must be representative of the end-user experience.
- At the same time it can be totally Meaningless™.
- ex. “Iteration time”:
- When divided by the number of jobs it represents the upper bound of the time between a job is received on internal queue and forwarded to the worker to be switched to the processing state and picked up by the processing engine.
- It should be between 0.1 and 5
- Why not 7 ?
- Beware of changes in code that affect the metric!
When watch the metrics?
- When incidents are triggered;
- Ideally every second morning;
- After deploy and During database migrations;
What are the best dashboards?
Eventually all end up like this:
The best ones are those that do not eat your battery when you’re on 24/7
Who’s watching the costs?
Budget alerts
- Everything else is wrong.
- Applies to personal pet projects too.
- Budget alerts also apply to the cost of the monitoring.
Hard Part
- Asynchronous jobs
- Containers that run from seconds to up to days
- Endless loop
- Non-interactive daemons that run for days to months
- Queue workers, stream processors, …
Some other time…
Thanks
Questions & Comments ?
![]()